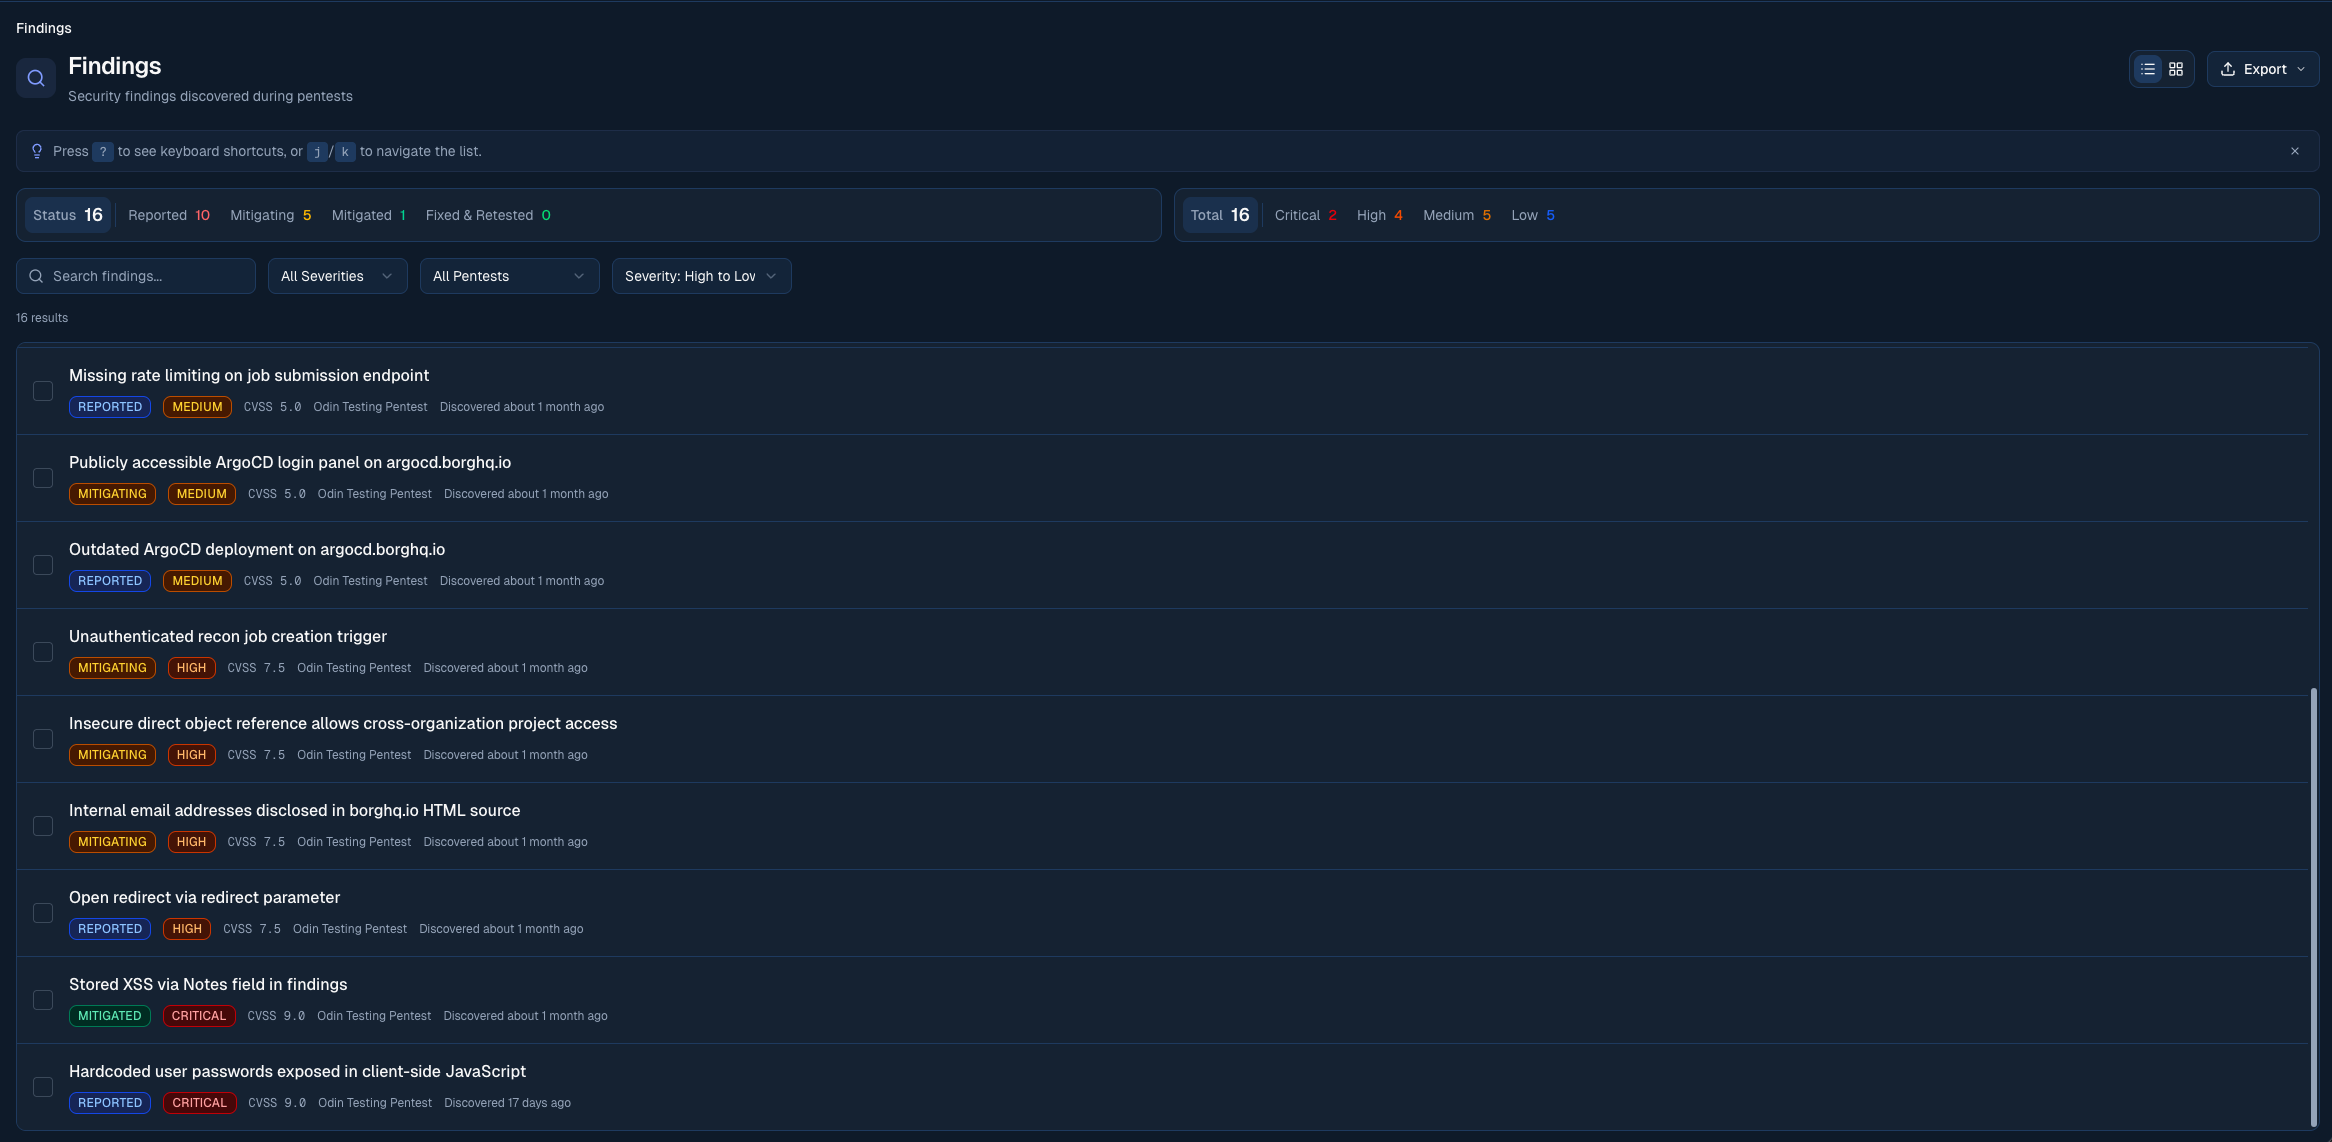
The Findings view shows all security issues across your workspace, sorted by severity
Severity levels
Each finding gets a severity based on exploitability and impact. Severity is set by Borg’s analyst team or by Mjolnir, and is anchored to a CVSS base score:
You can filter findings by source, severity, and CVSS range from the filters bar.
Confirmation type
Mjolnir findings carry a confirmation type alongside their severity. Severity is how serious the issue is. Confirmation type is how Mjolnir established it was real, and how much evidence sits behind it.
The confirmation type shows on each finding as a small bar icon that grows with confidence: one bar for Static, two for Partial, three for Exploited. Hover the icon, or open the finding, to see the label and a short explanation. Findings our analyst team raises by hand don’t carry a confirmation type, so you’ll only see the icon on Mjolnir findings.
Finding status
Each finding moves through a status lifecycle that captures the back-and-forth between your team and Borg as a fix is applied and verified:Changing the status
From the finding detail view, Member, Admin, and Owner roles can move a finding between client-controlled states:- Reported → Mark as Mitigating, or Acknowledge
- Acknowledged → Resume Mitigation
- Mitigating → Mark as Open for Retest, or Acknowledge
- Open for Retest → Reopen as Mitigating, or Acknowledge
- Needs Revision → Resume Mitigation, or Mark as Ready for Retest
Assigning findings
Assign a finding to a teammate so it’s clear who owns getting it fixed — the same way you’d assign an issue in Linear or Jira.- On the Findings list, each row has an assignee avatar in its own column, between the name and CVSS. Click the avatar — or the dashed placeholder on an unassigned finding — to pick an assignee inline, without opening the finding.
- Inside a finding, use the assignee control in the header to assign, reassign, or clear.
Following findings
Follow a finding to get notified about its updates, independent of whether you’re assigned to it.- Inside a finding, a Follow / Following button (bell icon) sits next to the assignee control, alongside a count of how many people are subscribed.
- Following a finding means you get notified about updates to it — status changes, comments, and other activity — through the Alert Centre.
- When a finding is reported, your organisation’s default finding subscribers are subscribed automatically — every non-Read Only member, unless your organisation has customised the list. If the delivery includes a Critical finding, those default subscribers are also emailed.
- Interacting with a finding subscribes you too: changing its status, commenting, being
@mentioned, or being assigned. - Assignees always follow the findings assigned to them and can’t unfollow while the assignment stands — unassign first if you want to stop following.
Finding identifiers and PR linking
Every finding has a unique, human-readable identifier made from your organisation’s finding prefix and a sequence number — for exampleBORG-12. The identifier is shown in the finding header and on every list view, and it’s how findings get connected to your engineering work.
When the GitHub integration is connected, referencing that identifier from a pull request — in the branch name, title, or body — links the PR to the finding automatically. You can also link one by hand. Linked PRs show as chips in the finding header and track their open, merged, or closed state live.
Linking a fix is also the trigger for verifying it: once a linked PR merges, Odin can review the change and confirm whether the finding is resolved, moving it to Fixed & Retested or Needs Revision without a manual retest step.
Automatic retests
How to link a pull request to a finding — three ways — and how Odin verifies the fix when it merges
What’s inside a finding
Every finding contains:- Title and severity: a one-line summary plus severity label and CVSS score
- Confirmation type: for Mjolnir findings, how strongly the issue was confirmed — exploited, partial, or static
- Type: when set, links the finding to its CWE class
- Affected assets: the domains, endpoints, or resources where the issue applies
- Description: what the vulnerability is
- Impact: the business consequence if it were exploited
- Details: technical details, including how the issue was identified
- Remediation: step-by-step fix guidance
- Proof of Concept: for Mjolnir findings, the request/response evidence captured during exploitation
- Code Reference: for Mjolnir findings with a code pointer, the exact file and line in your repository
- Status history: every status change, who made it, and any attached comment
Revisions
Findings are immutable. Whenever Borg’s analyst team or Mjolnir updates the content of a finding (after retesting, for example), a new revision is created and the revision number in the header increments. You always see the current revision, but the full history is preserved on Borg’s side for audit.Views
The Findings page has two view modes you can switch between in the toolbar:- List: the default tabular view, with filters, sort, and a detail panel
- Heatmap: a severity-by-status matrix showing how findings are distributed across your portfolio
Filtering and search
Filters at the top of the page narrow your view:- Severity: select one or more of Critical, High, Medium, Low
- Status bar: click any status to filter to it; Fixed & Retested and Acknowledged are hidden by default
- Source: filter by Mjolnir, Manual, Import, or Watchdog
- Confirmation: for Mjolnir findings, filter by how the issue was confirmed — Exploited, Partial, or Static
- Pentest: scope findings to a specific pentest engagement
- Asset: scope to findings affecting a specific asset
- Repository: for Mjolnir findings, filter by source repo
- Search: free-text search across titles and descriptions
- Sort: by severity (high → low or low → high) or by date
Bulk operations
Select multiple findings with the row checkboxes, or navigate withj/k and toggle selection with x. With a selection active, a bulk action bar appears at the bottom of the page:
- Update status — move all selected findings to Mitigating or Open for Retest
- Copy for Agent — copy a single prompt covering every selected finding, formatted to hand straight to a coding agent. A toast confirms how many findings were copied.
- Export — download the selected findings as CSV, CSV (summary), Markdown, or JSON
Bulk operations require the Member role or higher.
Discussion and activity
Every finding has a right-hand rail with two tabs:- Discussion: a threaded conversation with Borg’s analyst team. Use
@to mention a teammate, attach files, and resolve threads when a question is settled. You can edit or delete your own messages from the message’s menu; an edited message is labelled accordingly. The thread updates live, so replies from the Borg team appear as they are posted without reloading the page. New replies can trigger email notifications based on your discussion preferences. - Activity: a chronological feed of every status change, revision, and integration sync for the finding
Mentioning teammates, findings and projects
Typing@ in a discussion opens a search grouped into People, Findings, and Projects (pentests). Start typing a name, finding title or identifier, or project name to filter each group.
- People mentions notify the teammate, as they always have.
- Findings and Projects mentions are links only and notify no one. A mentioned finding shows as a chip with its current status and severity, and a mentioned project links through to its findings.
Exporting findings
Click Export in the page header to download your current filtered view. The export respects every active filter, so narrow down by severity, status, source, etc. before exporting.
Findings you’ve pushed to an issue tracker carry their linked issues into the export:
- CSV and CSV (summary) gain two columns after Status: Linked Issue References, which lists each issue by tracker and identifier (for example
GitHub #42orLinear ODIN-1272), and Linked Issue URLs. Where a finding has more than one linked issue, they’re separated by semicolons. These columns appear only when at least one finding in the export has a linked issue. - Markdown adds a Linked Issues line to each finding that has one, with every issue linking back to the tracker.
- JSON includes a
linkedIssueReferencesarray on each finding, recording the provider, identifier, URL, and provider-specific detail such as the repository or project.
From a single finding
The finding detail header has its own export controls:- Copy link — copy a shareable URL that opens this finding directly
- Copy Markdown — copy the finding as Markdown, or use the dropdown beside it to Download Markdown as a file
- Copy for Agent — copy a prompt describing the finding to hand to a coding agent
Pushing findings to your issue tracker
If you’ve connected Linear, Jira, GitHub, or GitLab, you can push any finding directly to your issue tracker with one click. The finding title, severity, description, impact, and remediation are all included, plus a deep link back to the finding in Odin. You can also enable auto-ticketing so that issues are created automatically as new findings are reported.Shortcut is also supported, but only through auto-ticketing or a bulk sync. There’s no one-click push for a single finding.
Set up integrations
Connect Linear, Jira, GitHub, or GitLab
Step-up verification
Some actions require re-authentication